The Deals and Alliance application includes advanced reporting features that allow users to generate dashboards in various formats, including funnel charts, bar charts, pie charts, tables, and heat maps. These reports can be exported to Excel or PowerPoint. In addition, a scheduling feature allows the users to receive reports on a regular basis via email.
Dashboards are not populated with system data in real time, but by a connector that brings in the data on a daily basis. So when users add or update data in the system, they will only see the related modifications to the dashboards the following day.
With advanced reporting, a library of pre-configured reports are available in the application. These reports generally follow the standard configuration of the application. Click here for details.
Access the Dashboards
In the main menu, click the Dashboards link.
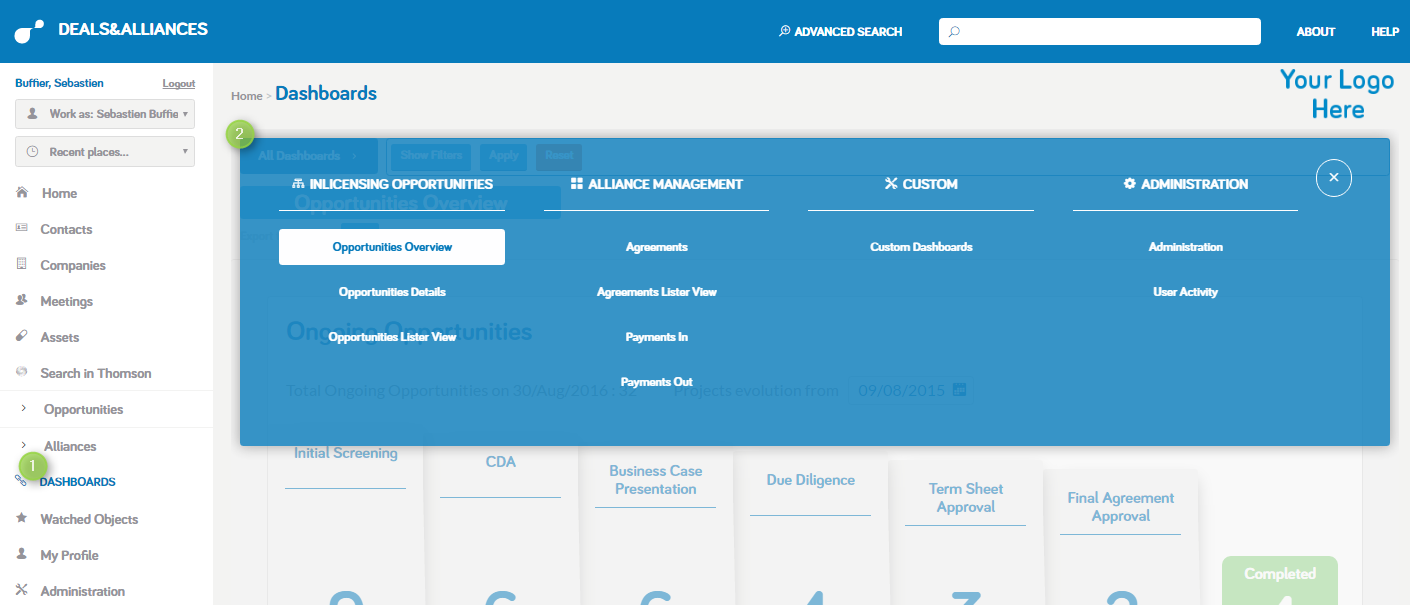
- If the link is not displayed in the menu, the dashboards have not been activated. Contact your Inova administrator for details.
- To see a list of all the dashboards available to you, click All Dashboards. The dashboards are grouped by module.
All dashboards can be filtered. To see filter options, click the Show Filters button.
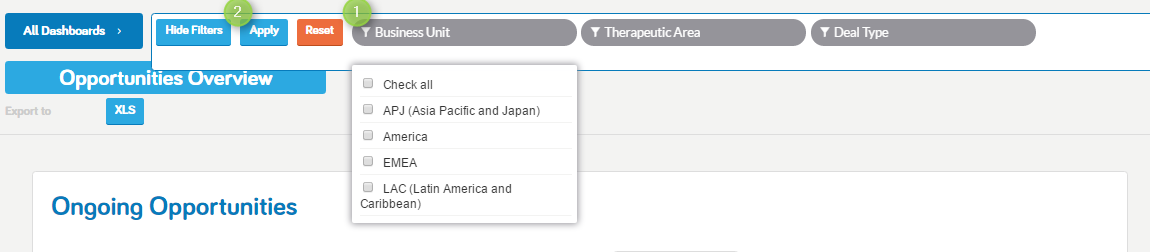
- Filtering criteria are displayed in grey, as shown in the screenshot. Check the values you want to filter by. You can filter by multiple criteria at a time.
- Click Apply. The criteria will automatically be applied. To remove the filter, click Reset.